Eye Tracking Analysis Software
InsightLab is a comprehensive eye tracking analysis software for diverse behavioral research
InsightLab is a dedicated software platform designed for screen-based eye tracking studies. Built to meet the high standards of psychology, neuroscience, consumer research, and UX studies, it provides core functions for raw data enrichment, aggregation, and extraction of eye tracking metrics, ensuring accurate and replicable results across research fields.
Based on validated workflows from peer-reviewed research, InsightLab leverages decades of expertise. It enables fast, efficient processing of eye tracking data, helping researchers achieve results with ease. Whether for academic or professional use, InsightLab accelerates research and makes data analysis fast and intuitive.
Evaluate our eye tracking solution with a 4-week free trial.
Researchers based in the European Union are welcome to contact us.
The evaluation package includes the Lite 120 eye tracking hardware and InsightLab experimental and analysis software, providing your
team with full access to our complete, research-grade solution. Simply fill out the form and tell us about your research focus to get started.

Node based experimental designer
A powerful yet easy-to-use tool for creating and managing experiments and stimuli. Its intuitive interface makes setup simple and clear to design and customize experiments, even without technical expertise. Every step is structured and easy to understand, so you can focus on your research instead of complex software.

Live observation during recording
Live observation of the participant’s behavior during recording is essential to comment, annotate in real time, and intervene immediately if necessary. It enables deeper understanding and better data quality. InsightLab live observation is simple to set up and to manage – making high-quality insights accessible and efficient.

Various visualization capabilities
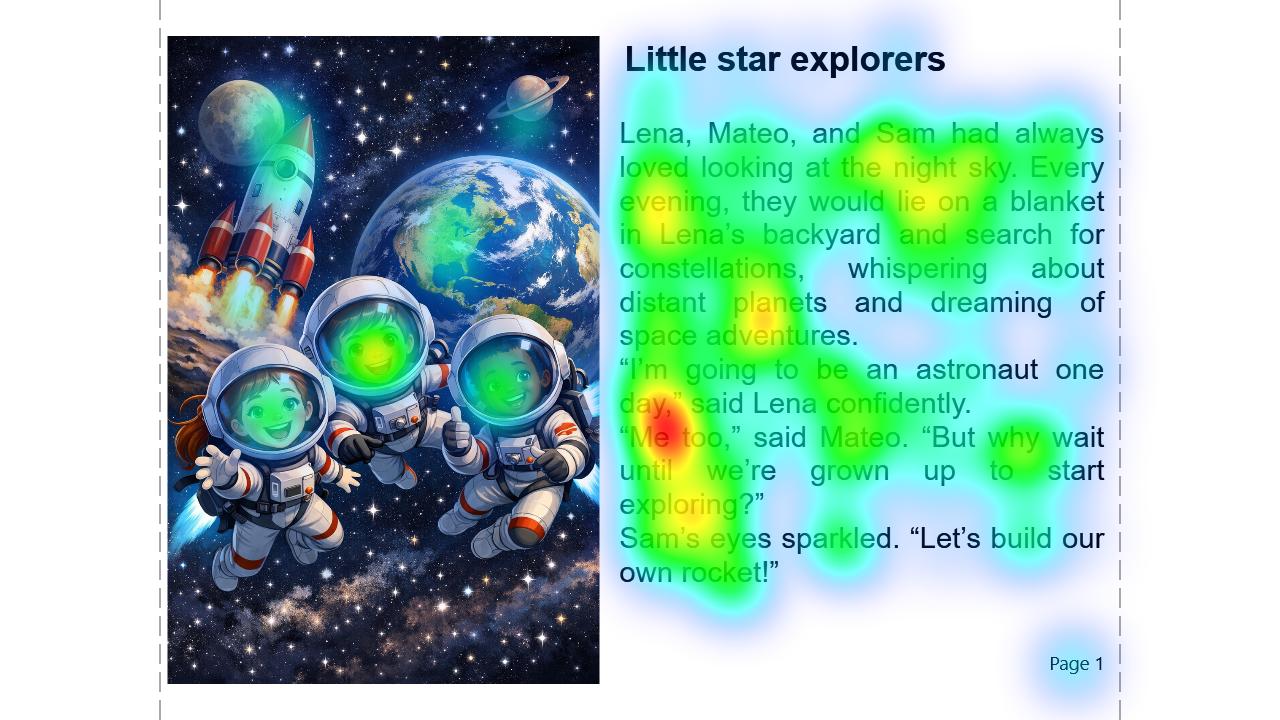
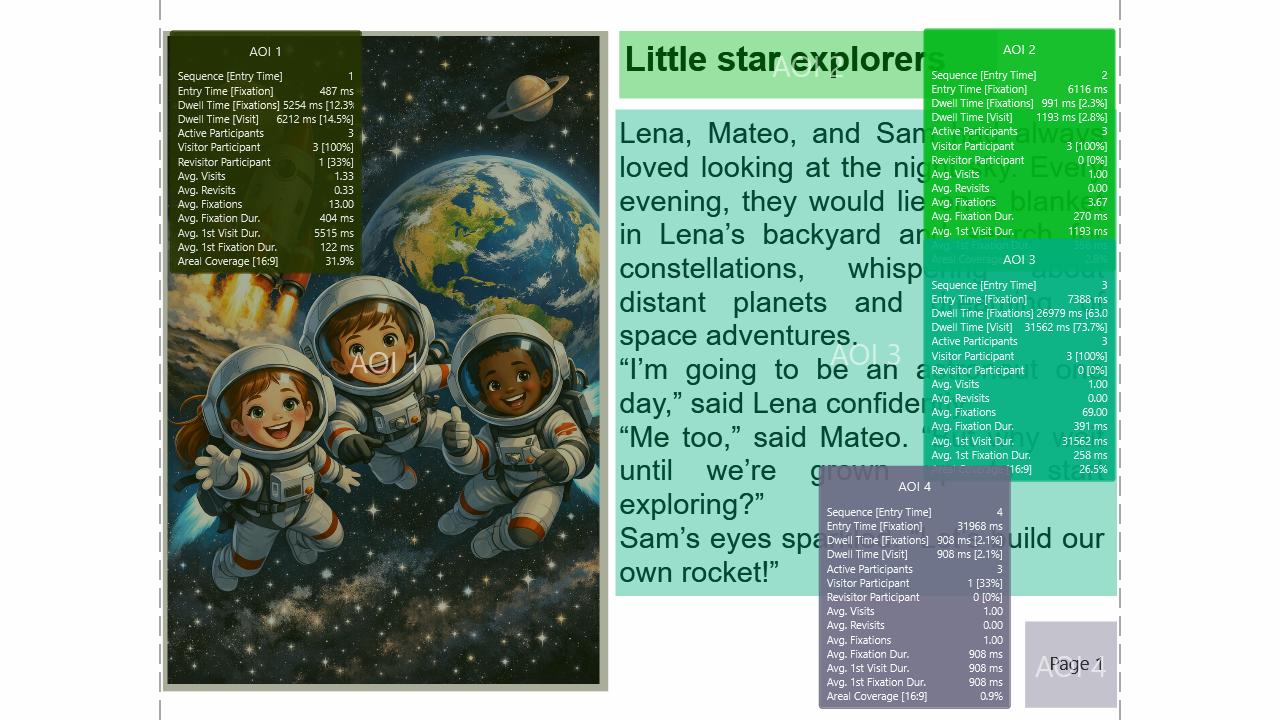
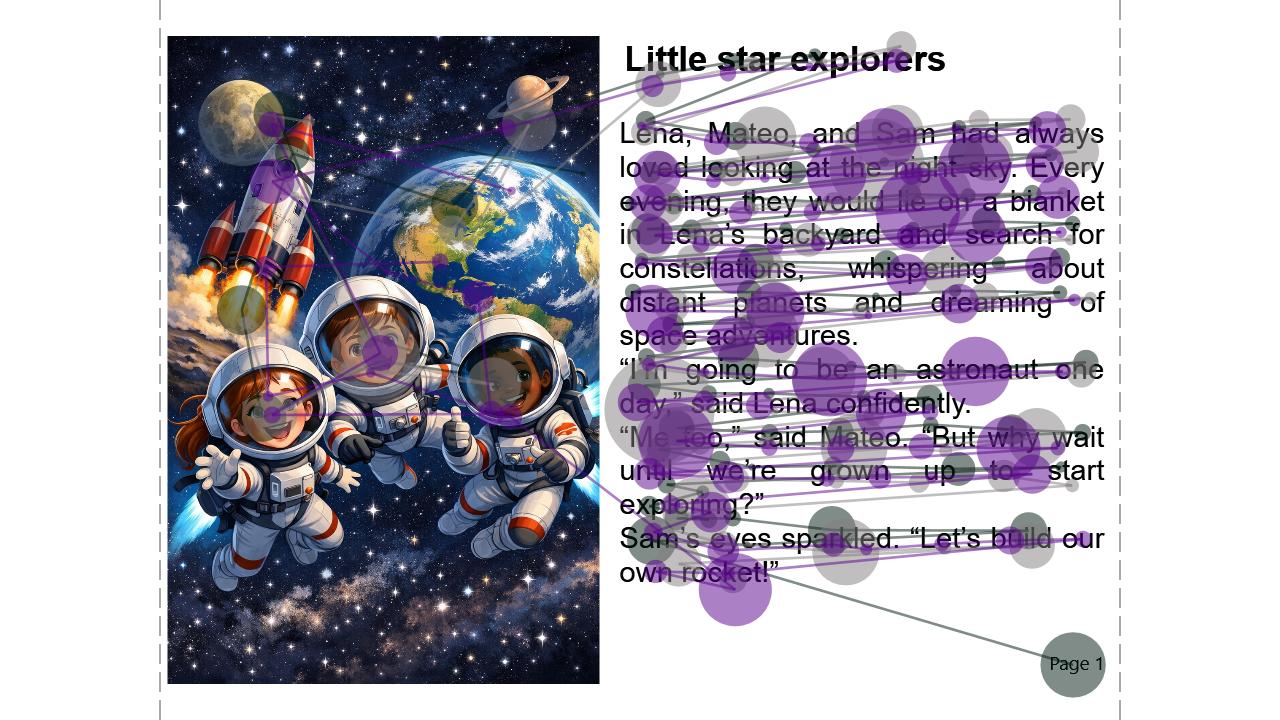
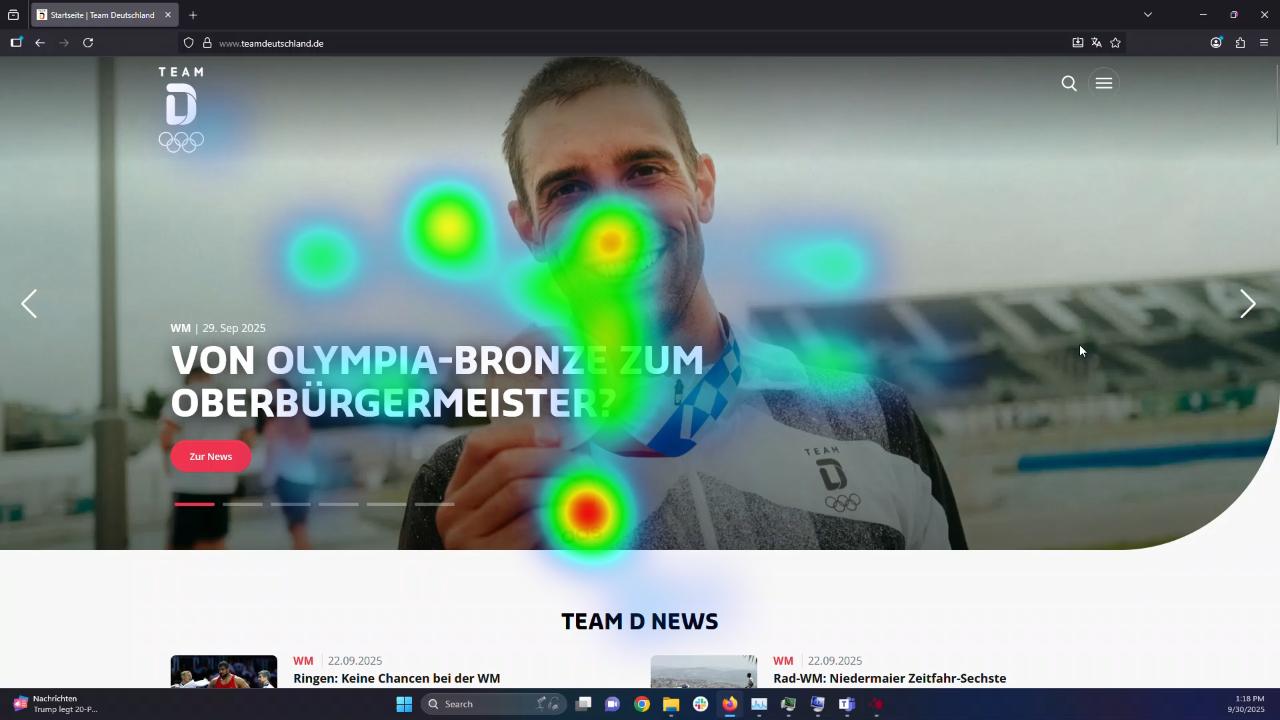
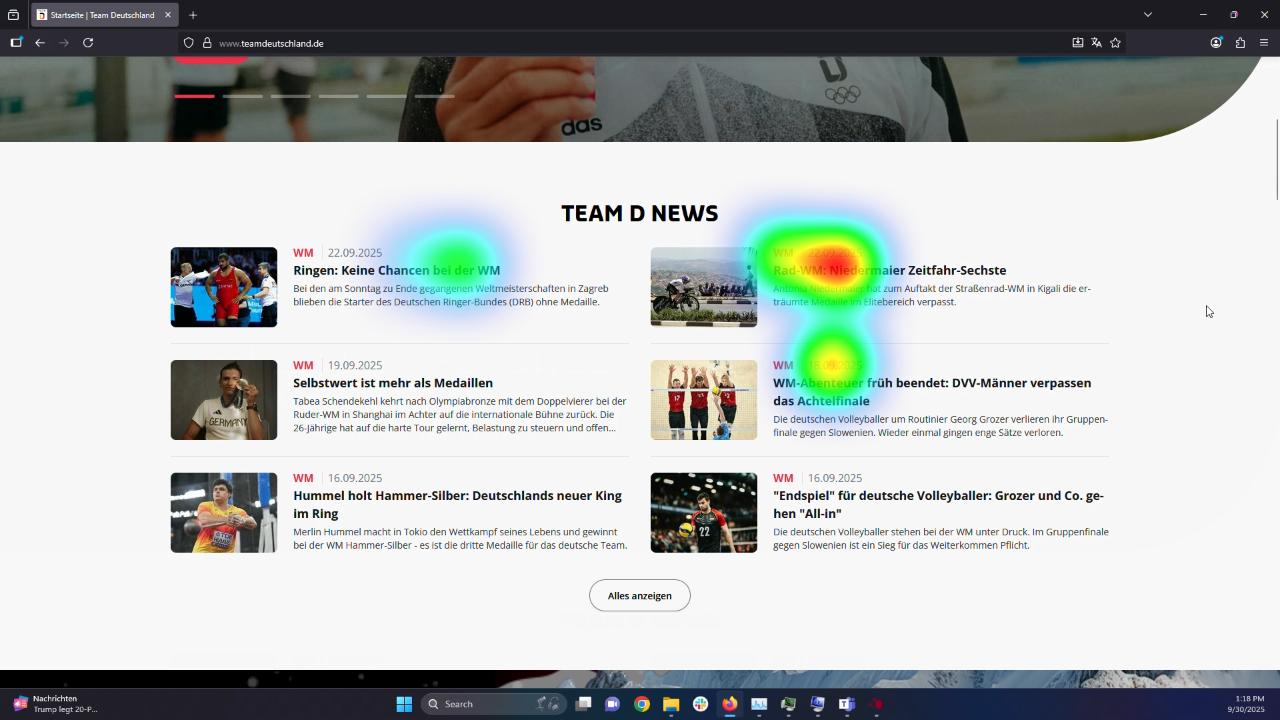
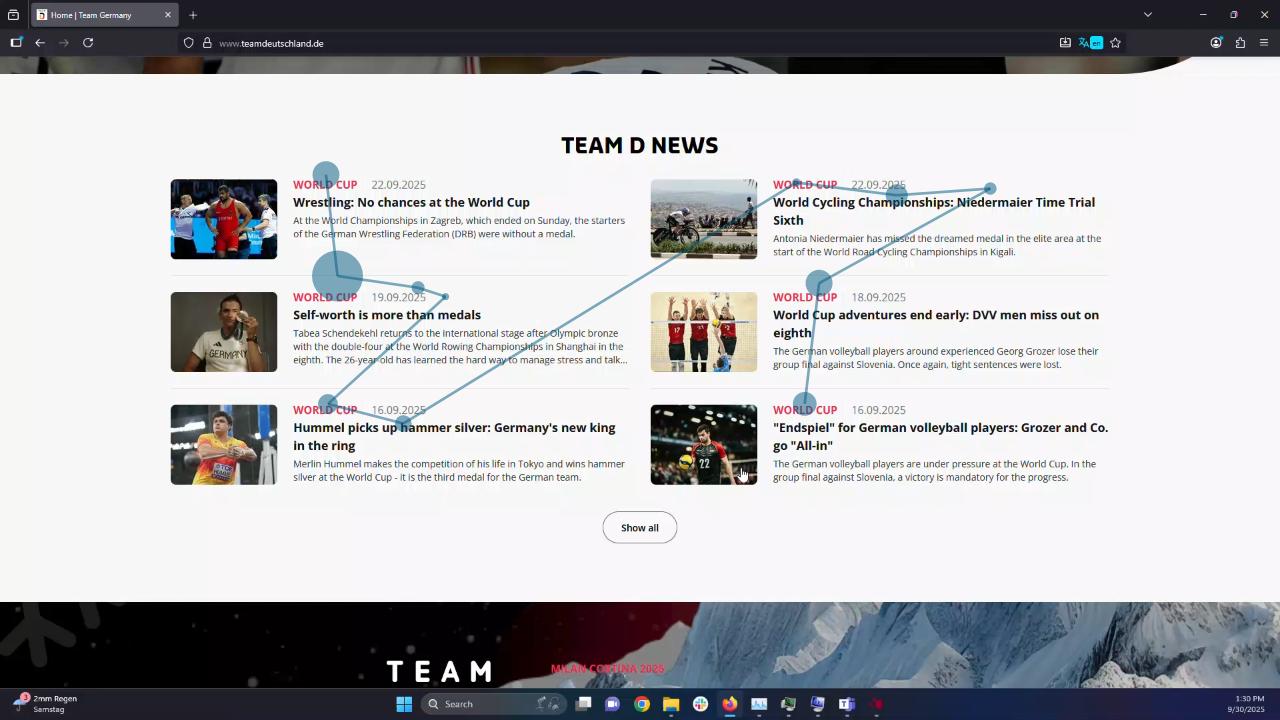
InsightLab uses state-of-the-art, scientifically evaluated research methodologies to ensure precise visualization and accurate AOI computation. By combining validated analytical frameworks with advanced technology, it delivers reliable, transparent results that meet the highest academic and industry standards.
InsightLab is designed to complement EyeLogic’s eye tracking hardware


InsightLab Features
| Software Suite | All-in-one experiment software, containing: Experiment Designer, Data Collection and Data Analysis |
|---|---|
| Technology | Optimized for screen-based eye tracking research |
| Input Sensors | Compatible with all EyeLogic sensors, i.e. LogicOne and Lite |
| Additional Input Sensors | Input from keyboard and mouse are recorded and synchronized |
| Data format | Stored in dedicated project files and can be exported into various formats (i.e. csv, xlsx, png, mp4) |
| Design Interface | Intuitive editor for an efficient experimental design process |
|---|---|
| Stimulus Slides | Customizable stimulus slides by placing stimulus components via drag-n-drop |
| Stimulus Elements | Broad range of elements, such as: images, videos, text, questionnaires, screen recording |
| Experiment Workflow | Fully customizable experiment workflow, using a graph-based editor for intuitive experiment design |
| Version Control | Full control over design history and stimulus versions |
| Preparation | Easy to set up data recording using live sensor previews, with seamless support for multi-monitor setups |
|---|---|
| Dry Run | Available for a test-run of the experiment without data recording |
| Participant Properties | Tag recordings with custom participant-specific data (e.g. age, gender, etc.) for later filtering |
| Real-time Feedback | Instant visual feedback on participant’s eye tracking behavior during the recording |
| Annotations | Possibilities for annotations during recording |
| Synchronization | Accurate time synchronization between the presented stimuli and the sensor input |
| Analysis | Powerful tool which visualizes data in various contexts |
|---|---|
| Data Visualization | Powerful and fast aggregated visualizations, like: scan path, heat map, raw pathall for individual subjects and custom groups |
| AOI Statistics | Available AOIs on all stimuli elements: Rectangular, Circular/Ellipsoidal, custom shaped |
| Time Control | Show results either overall, at a specific time point in your experiment or for a custom time span |
| Playback | Interactively playback your experiment and overlay analysis results |
| Filter | Filter recordings based on tags, subject data or by manual input |
| Export | Export static images, videos or statistics with visual overlays or data formats |
| Data Control | Full control over all data, recordings and analysis results |
|---|---|
| Exported data | Raw gaze data, fixations, saccades, pre-calculated metrics, analysis diagrams with overlay, analysis videos with overlay |
| Export format | Numerical files (csv, xlsx) Video/Image file (mp4, png) |
| Min. Requirements | Intel core i5 CPU or comparable, 8 GB RAM, Microsoft Windows 10 or 11 |
|---|---|
| Recommended Requirements | Intel core i7 CPU or comparable, 16 GB RAM, Microsoft Windows 11 |
- General
- Stimulus Designer
- Data Collection
- Analysis
- Data Export
- System Requirements
| Software Suite | All-in-one experiment software, containing: Experiment Designer, Data Collection and Data Analysis |
|---|---|
| Technology | Optimized for screen-based eye tracking research |
| Input Sensors | Compatible with all EyeLogic sensors, i.e. LogicOne and Lite |
| Additional Input Sensors | Input from keyboard and mouse are recorded and synchronized |
| Data format | Stored in dedicated project files and can be exported into various formats (i.e. csv, xlsx, png, mp4) |
| Design Interface | Intuitive editor for an efficient experimental design process |
|---|---|
| Stimulus Slides | Customizable stimulus slides by placing stimulus components via drag-n-drop |
| Stimulus Elements | Broad range of elements, such as: images, videos, text, questionnaires, screen recording |
| Experiment Workflow | Fully customizable experiment workflow, using a graph-based editor for intuitive experiment design |
| Version Control | Full control over design history and stimulus versions |
| Preparation | Easy to set up data recording using live sensor previews, with seamless support for multi-monitor setups |
|---|---|
| Dry Run | Available for a test-run of the experiment without data recording |
| Participant Properties | Tag recordings with custom participant-specific data (e.g. age, gender, etc.) for later filtering |
| Real-time Feedback | Instant visual feedback on participant’s eye tracking behavior during the recording |
| Annotations | Possibilities for annotations during recording |
| Synchronization | Accurate time synchronization between the presented stimuli and the sensor input |
| Analysis | Powerful tool which visualizes data in various contexts |
|---|---|
| Data Visualization | Powerful and fast aggregated visualizations, like: scan path, heat map, raw pathall for individual subjects and custom groups |
| AOI Statistics | Available AOIs on all stimuli elements: Rectangular, Circular/Ellipsoidal, custom shaped |
| Time Control | Show results either overall, at a specific time point in your experiment or for a custom time span |
| Playback | Interactively playback your experiment and overlay analysis results |
| Filter | Filter recordings based on tags, subject data or by manual input |
| Export | Export static images, videos or statistics with visual overlays or data formats |
| Data Control | Full control over all data, recordings and analysis results |
|---|---|
| Exported data | Raw gaze data, fixations, saccades, pre-calculated metrics, analysis diagrams with overlay, analysis videos with overlay |
| Export format | Numerical files (csv, xlsx) Video/Image file (mp4, png) |
| Min. Requirements | Intel core i5 CPU or comparable, 8 GB RAM, Microsoft Windows 10 or 11 |
|---|---|
| Recommended Requirements | Intel core i7 CPU or comparable, 16 GB RAM, Microsoft Windows 11 |
Freqently asked questions
For additional information, send us a contact request.
When using InsightLab eye tracking analysis software, a variety of biometric data is recorded to provide detailed insights into visual behavior. This includes gaze position, pupil size and dilation, fixation duration and saccades. Collecting these data points allows for comprehensive analysis of focus and attention, cognitive load, and emotional responses during experiments.
InsightLab computes essential metrics for Areas of Interest (AOIs) to facilitate detailed eye tracking analysis. These include fixation count, dwell time, first fixation duration, and time to first fixation. Additionally, the software measures visit count and revisits, providing insights into visual attention patterns and user behavior during experimental tasks.
InsightLab supports a broad range of stimulus elements across multiple slides, precisely synchronized to accommodate diverse experimental designs. It can present static images, dynamic videos, text, and various types of questions. Additionally, InsightLab can record the participant’s screen while they interact with any software. These capabilities facilitate the creation of complex visual scenes and interactive elements, enabling researchers to design customized and engaging stimuli tailored to their specific study requirements.
InsightLab offers versatile export capabilities to support your eye tracking data analysis and reporting needs. It allows you to export raw eye tracking data as well as processed AOI statistics in common formats such as CSV and Excel, making it easy to integrate with statistical software or further analyze in spreadsheets. Additionally, InsightLab can export visualizations like heatmaps and gaze plots in image and video formats for presentations and reports. This flexibility ensures you can efficiently share and utilize your eye tracking results across different platforms and workflows.